Field
Location (during time of takeover)
School/Institution
Featured on May 11, 2021
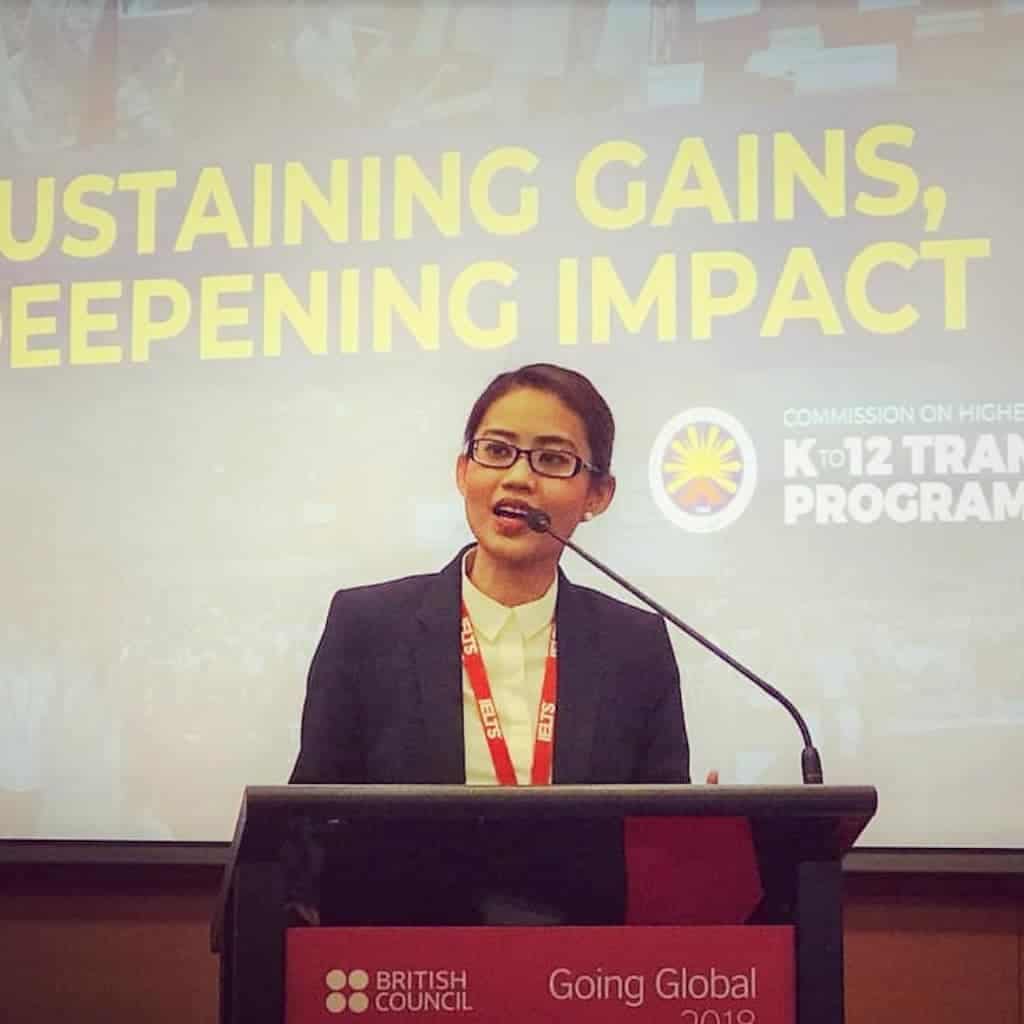
Hello, everyone! I’m Renz Calub. I teach econ theory and econometrics at DLSU School of Economics and I work as an economics research consultant at the Asian Development Bank. I obtained my bachelor’s and master’s degree from the UP School of Economics and now I’m taking my PhD at DLSU School of Economics – after 6 years of contemplation whether I should continue to make my life more stressful challenging sans the mental stamina of a fresh college grad that I was 11 years ago.
Aside from making economics more relatable and fun for everyone, I’m also a self-confessed econometrics and programming geek. So for Technique Tuesday, let me share with you a glimpse of what I do.
I’m part of the team that studies the role of urbanization and transport mobility on economic development. Data and econometrics play a huge part in this project, so I use statistical packages like Stata and R to execute and produce the analyses.
I’ve been using Stata for 10 years now. Those years of experience have eventually culminated to writing executable programs that automated data crunching and regression analysis. Stata is also one of the statistical packages used by DLSU for econometrics, so I always include programming lessons and data management on top of teaching theory. I want my students to realize that writing code is definitely easier than manually digging through sheets and sheets of data with thousands of rows.
But I didn’t stop there. I also started to learn R! It’s challenging, I admit, but my experience with Stata has somehow made the transition easy. R works best with nested datasets and files scraped from the web, so learning this language is definitely worthwhile.
On a personal note, writing flawless codes gives that Doctor Strange sorcerer feels. It’s magic! That’s why I enjoy my work.
But when did that magic really start? Back in college, I didn’t really know anything about statistical packages. I mean, I know how to write formulas and create charts using Excel, but I was one of those students who (abhorrently) copied and pasted spreadsheets in Stata (and in Eviews for my undergrad thesis) and used the GUI interface to create summary tables and to run linear regressions.
The real training started when I worked as an RA for the Health Policy Development Program of UPecon Foundation, Inc. Day in, day out I had to write do-files to process demographic and health data that will then be used for drafting and implementing health policies. It was a learning experience, for real. There were days that I had to wait until midnight for the code to finish crunching out population counts at the barangay level. I had a lot of tense meetings where we had to run the codes while our chief watched. ???????? Nonetheless, it was an awakening. I didn’t realize sooner that those days really paid off as I acquired a better sense of how data should be processed, how survey questionnaires should be read. As a side note, that year of policy work also led me to health economics as a subfield (see throwback photo during a poster presentation).
So now, I don’t really get intimidated by data anymore. Those skills came in handy when I became a consultant for ADB (see team photos). Bilateral trade data? Development indicators? Traffic flow? Just let me know what you need and I can concoct the codes/programs to produce the output.
But you know what? The best lesson that I got from all this is the importance of data and statistics in making people’s lives better. Planning for better health outcomes requires knowing the health care needs – we need data for that. Building better cities requires data. Economic theory can only go so far in describing reality; we need data and econometrics to provide a more vibrant, meaningful, and relevant story.


